How To Simplify Your Analytics Data for Your Boss
In this age of data, people at all levels of business have access to their company’s website traffic metrics. Often, it’s those further down the ladder who are expected to stay on top of it, whether they like it or not. Richard Branson is famous for not wanting to understand his company’s financial data in too much detail. He doesn’t need to – but he does need to know the basics to make good decisions, which he does to great effect. His mind is free of the clutter to make the big picture decisions.
Like Branson, many business owners are strapped for time and cannot spend hours parsing through their web analytics accounts. They are looking for simplified data. Believe me, it’s a challenge not lost on SEO practitioners. Here’s some suggestions if you’re using Google Analytics, to help your boss see the big picture.
1. Create a custom dashboard with just your main reports
From your Home screen within GA, you can easily add and remove widgets to build a dashboard that highlights metrics you’re most interested in. Personally I don’t think that GA has done a good job with the display, but it will keep reports in one interface.
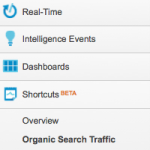
 2. Use the Google Analytics ‘Shortcuts’
Here you can essentially pin you favorite reports to the sidebar and click-through them like a navigation. This is my favorite way of navigating through. Simply pull open the full report of your choice (selecting any criteria you like) and click the Shortcut button in the toolbar toward the top of the screen.
3. Set up weekly or monthly email reports
You can set up reports in PDF (looks the best) or other formats, to be emailed automatically with a frequency of your choosing. These report contain more ‘raw data,’ but it’s handpicked by you, and you can add an intro to the emails to explain.
4. Use a 3rd party service
There are companies out there that specialize in providing data services. One Boston firm called Lucidel, for example, simplifies Google Analytics reports and as an extra bonus includes demographic data through a data collecting API.
5. Create a 1-page executive summary
Depending on how frequent these are needed and how much time you have, you could pull together a 1-pager with top-level metrics, some other data insights and a quick analysis.
If you have hours to spend in Google Analytics, there’s a great deal of insight to be learned about your website. For your time-strapped boss, start with the suggestions above to keep them easily informed about important top-level metrics.

